

:quality(80)/p7i.vogel.de/wcms/ac/24/ac2495bc671ef2a8bf95bdb0de7f172a/0131908887v1.jpeg "An artistic rendering of a boron nitride nanotube developed by UIC researchers and their collaborators in a new study. (Source: Rendering by Ella Maru Studio, Inc. Courtesy of Sangil Kim)")
:quality(80)/p7i.vogel.de/wcms/dd/be/ddbe621ac35ec49d9aee43615173f703/0131898392v2.jpeg "The acquisition is consistent with GSK’s strategy of acquiring assets that have validated targets and meaningfully address efficacy and/or tolerability limitations of existing standard-of-care therapies. (Source: Pixabay)")
:quality(80)/p7i.vogel.de/wcms/e2/ae/e2aea4192de2e22dd33d19afee25f312/0131779278v1.jpeg "The artificial photosynthesis system produces formic acid from carbon dioxide and water. The right image shows the group’s unique electrolyzer.
(Source: Osaka Metropolitan University)")
:quality(80)/p7i.vogel.de/wcms/49/03/49033fd7e1cb79cd90776e8d0583b441/0131773380v1.jpeg "Taken from above, this annotated image shows a schoolground in Spain and the motions of teenage participants as indicated by the dots and lines. (Source: Echeverría-Huarte et al.)")
:quality(80)/p7i.vogel.de/wcms/f5/8d/f58d7181bd0660dea9e33b89f15947eb/0131589395v2.jpeg "Equipping all your HPLC systems running standard separation protocols with an automated non-invasive flow monitoring system, such as Flowchrom, is the only true solution. (Source: Testa Analytical)")
:quality(80)/p7i.vogel.de/wcms/63/44/63443a618001fbdc12e18de386a7b548/0131588936v2.jpeg "These compact, chemically inert degassers use trusted Degasi degasser parts, combined in a manner optimized to your specific system requirements. (Source: Biotech Fluidics)")
:quality(80)/p7i.vogel.de/wcms/47/13/4713969ee1fed4c9d6cd932df7c82482/0131588920v2.jpeg "My Genius Pro installed at a leading European transplant center supporting routine infectious disease testing. (Source: Elitech Group)")
:quality(80)/p7i.vogel.de/wcms/45/d9/45d9cf5be3c10b389fd712f319fbfce1/0131588911v2.jpeg "The Nexis GC-2060 supports both routine and ad-hoc analyses through a range of workflow support functions tailored to operational needs – from automating analytical tasks to on-demand operation that analyses exactly what is needed, when it is needed. (Source: Shimadzu)")
:quality(80)/p7i.vogel.de/wcms/b6/6a/b66a4a25066ff8e426cd9f574b72c7b9/0131905275v1.jpeg "PLA plastic (left piece) usually takes months to break down in industrial composting facilities, but incorporating a sprinkling of an organic additive dramatically speeds the process for a modified PLA plastic (right piece) to less than three weeks.
(Source: Jinsol Yook)")
:quality(80)/p7i.vogel.de/wcms/9f/d8/9fd8ffb67c1132b4f48dc60e4e194226/0131784166v2.jpeg "Still life featuring protein beads loaded with potassium hydroxide. The porous act as a sponge for CO2. (Source: Mezzenga Lab / ETH Zurich)")
:quality(80)/p7i.vogel.de/wcms/3e/47/3e472068bf13aadf4786e947ae148759/0131779258v2.jpeg "Salts, organic matter and other chemical constituents in natural fresh water and seawater suppress sunlight's ability to degrade plastic. Because sunlight cannot effectively initiate the degradation process, microbes cannot finish the job. That means nature’s cleanup process slows down, allowing plastics to accumulate and persist in waterways around the world. (Source: Ludmilla Aristilde/ Northwestern University)")
:quality(80)/p7i.vogel.de/wcms/bc/bc/bcbcf8be4b6c996f6ff231cb65937953/0131673749v1.jpeg "Sewage overflows occur when untreated sewage enters homes or the environment through broken or clogged pipes, or when the sewage system is overwhelmed. (Source: free licensed)")
:quality(80)/p7i.vogel.de/wcms/ac/33/ac339ce19b25f78e11a8dc8ef137869b/0131904977v2.jpeg "An “electronic nose” created by UC Berkeley researchers can detect the gases emitted by spoiled food and food allergens better than human noses. (Source: Brandon Sánchez-Mejia/ UC Berkeley)")
:quality(80)/p7i.vogel.de/wcms/b2/f9/b2f99d68013e2a6ab65e6c86254ec8a9/0131802730v2.jpeg "The UK currently eats 31 % less seafood than is recommended by government guidelines. (Source: University of Bristol)")
:quality(80)/p7i.vogel.de/wcms/1e/ed/1eed2310aac6373fe3d57c8f9d2809d6/0131673857v2.jpeg "“Addressing structural and policy-related barriers to accessing fresh and minimally processed foods remains critical for promoting dietary changes that improve the health and life span for all Americans,” said Dariush Mozaffarian, cardiologist and director of the Food is Medicine Institute at the Friedman School of Nutrition Science and Policy at Tufts University.
(Source: Imani Khayaam for Tufts University)")
:quality(80)/p7i.vogel.de/wcms/48/97/4897129d96e4ab9287933406b153ab51/0131163956v2.jpeg "Eating one egg per day for at least five days a week reduces risk of Alzheimer’s by up to 27%, researchers found. (Source: free licensed)")
:quality(80)/p7i.vogel.de/wcms/17/20/1720579fad3f2e89bc1e190e42ee7c8f/0131911326v2.jpeg "Wild cotton, on left, has short, brown, and coarse fibers, while modern domesticated cotton has white, fine and abundant fibers. A new study led by Iowa State University scientists identified the northwestern Yucatan Peninsula in Mexico as the original source of domesticated cotton. (Source: Corrinne Grover/ Iowa State Universit)")
:quality(80)/p7i.vogel.de/wcms/e0/47/e0471aba187b684e713df3c4d63461f8/0131909497v1.jpeg "Banded mongooses (Mungos mungo) can cooperate with common warthogs (Phacochoerus africanus) by cleaning them, removing ticks and other parasites, while the warthogs provide access to food and safety from predators through their vigilance and presence. Example footage from Queen Elizabeth National Park, Uganda.
(Source: Leela Channer)")
:quality(80)/p7i.vogel.de/wcms/db/28/db28c59875bbfbeae78aac866c08ffa3/0131901880v2.jpeg "Scientists at Northwestern University and Shirley Ryan Abilitylab have developed a first-of-its-kind rehabilitation system that virtually connects therapists and patients through robotic exoskeletons. (Source: Shirley Ryan Abilitylab)")
:quality(80)/p7i.vogel.de/wcms/bb/51/bb51f90e36d72be4dd360c026642b09c/0131843656v2.jpeg "As patients live longer, they are at an increased risk of developing valvular heart disease after successful cancer therapy. (Source: Pixabay)")
:quality(80)/images.vogel.de/vogelonline/bdb/1710600/1710675/original.jpg "Discover how to set yourself up for success when performing balance-based density determination of solids such as jewelry and precious metals. (Mettler Toledo)")
:quality(80)/images.vogel.de/vogelonline/bdb/1682500/1682579/original.jpg "The new XPR Analytical balance redesigned to meet the needs of laboratory technicians of working fast and lean. (Mettler Toledo)")
:quality(80)/images.vogel.de/vogelonline/bdb/1677000/1677080/original.jpg "Enhance your weighing accuracy, comfort and productivity with the redesigned XPR Analytical balance. (Mettler Toledo)")
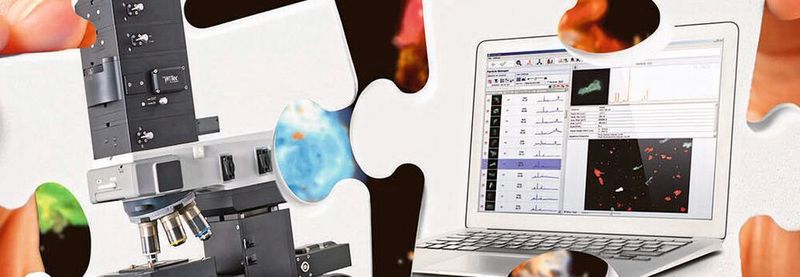
Microparticles Automated Microparticle Analysis with Raman Microscopy
The pollution of water, food and the environment by microparticles and especially micro- plastics is a growing concern. Therefore, efficient techniques for analyzing them in detail are urgently needed. A Raman microscopy system equipped with an advanced software package enables researchers to automatically find, classify and identify microparticles.
Related Vendor
Microparticles are in everyday products such as food, cosmetics and paint and have recently made their presence felt in the news as well. For example, microplastic particles in the environment have received attention due to the potential risks they pose for ecosystems, animals and humans [1]. According to the International Union of Pure and Applied Chemistry (IUPAC), microparticles measure between 0.1 µm and 100 µm in size, but the exact range is under debate [2]. Other definitions include particles of up to 5 mm [1]. Microparticle analysis is challenging as large areas have to be scanned and even very small particles must be recognized [1].
While a huge number of particles are usually present on a substrate, often only a subset of them is of interest. Manually selecting and inspecting all the particles is time-consuming and error-prone [3]. Thus, automated and standardized processes for finding and selecting particles of interest over large areas are necessary [1,3,4]. Such methods can be combined with reliable techniques for characterizing and identifying the detected particles [5,6]. The whole procedure should of course be as fast as possible and yield a detailed overview of the sample properties. Witec Particlescout, an advanced microparticle analysis tool, fulfills all of these requirements.
:quality(80)/images.vogel.de/vogelonline/bdb/1622200/1622239/original.jpg "(Witec)")
:quality(80)/images.vogel.de/vogelonline/bdb/1622200/1622241/original.jpg "(Witec)")
:quality(80)/images.vogel.de/vogelonline/bdb/1622200/1622242/original.jpg "(Witec)")
:quality(80)/images.vogel.de/vogelonline/bdb/1622200/1622243/original.jpg "(Witec)")
Automated particle analysis with Raman imaging
Using a confocal Raman microscope equipped with Witec Particlescout, every step of the particle analysis workflow can be carried out in one system with a high level of automation, as outlined in the following.
- Large-area overview for finding many particles: In order to examine particles on a substrate, a white-light image is acquired in which particle outlines can be recognized. Often a dark-field image yields better contrast for particle recognition than a bright-field image (Fig. 1A, B). For detecting even small particles, a large magnification is needed, which of course reduces the field of view. Additionally, the sizes and shapes of particles in a sample are usually heterogeneous, so some particles can be out of focus. Both issues can be solved by using image stitching and focus stacking, which are implemented in the Witec Control software. Image stitching combines images from several areas into one overview, while focus stacking generates a sharp picture from several images from different focal planes. Thus, Witec Raman microscopes record sharp images from large areas at high magnification (Fig. 1A, B). Particlescout then automatically locates particles in the image using a brightness threshold. If there are many dim particles in the sample, their intensities can first be enhanced so that even small and dim particles are found by the algorithm.
- Classifying particles according to physical properties: The locations of all found particles are represented as a mask (Fig. 1C) and physical properties such as perimeter, area or circular equivalent diameter are automatically calculated for each particle. These properties can then be used to group the particles. Any further analysis can be performed for all particles or limited to selected subsets. For recurring processes, filters can be predefined and saved.
- Identifying particles with Raman spectroscopy: Raman spectroscopy is ideally suited to the chemical identification of microparticles as a Raman spectrum can serve as a fingerprint for individual materials (see LAB Info box “Confocal Raman microscopy”). With Particlescout, Raman spectra are acquired only from the particles of interest, which is much faster than recording a Raman image of the entire field of view. Facilitated by the excellent spatial resolution of Witec Raman microscopes, the excitation light is guided precisely to each particle location. When equipped with Particlescout, they are able to analyze hundreds of particles per hour thanks to their unique speed and sensitivity. The microparticles are identified by their acquired Raman spectra (Fig. 1D). To expedite this operation, Witec’s powerful Raman spectral database management software, Truematch, is seamlessly integrated with Particlescout. It searches commercial or user-generated databases quickly and reliably identifies particles. Particlescout offers extensive possibilities for gaining an overview of the sample composition and detailed insight into specific property distributions. Reports can be generated that relate particle materials to physical properties such as area or perimeter, as will be shown in the following examples.
Microplastic particles in environmental samples
Environmental pollution involving microplastic particles is of increasing concern due to their potentially harmful effects on the natural world and human health [1]. Such effects can only be assessed if it is possible to quickly and reliably identify microplastics in environmental samples and to analyze their abundance and size distribution [4,5]. The aim of the following measurement was to quantify the amount of microplastic particles in a sludge sample from a wastewater treatment plant (sample courtesy of Dieter Fischer, Leibniz Institute of Polymer Research, Dresden, Germany). Figure 2 shows a dark-field image of the filter (pore size: 10 µm) on which tens of thousands of particles from the sludge sample are retained. Raman spectra from about 18,000 particles were acquired automatically using a Witec alpha300 R equipped with Particlescout. Out of these, 46 were unambiguously identified as microplastic particles by Truematch. This represents approximately 0.25% of all measured particles. Polyethylene (25 particles) and polypropylene (12 particles) were by far the most abundant types found. Their sizes varied from 5 µm to more than 50 µm (circular equivalent diameter). Additionally, many different pigments and several titanium dioxide particles were found in the sludge sample.
Detailed analysis of selected subsets
The following example shows how Particlescout can be used to conveniently isolate particles of interest for more detailed analysis. The sample was prepared by Reshef Tenne (Weizmann Institute, Israel) and kindly provided through Martin Konečný and Tomáš Šikola (Ceitec, Institute of Physical Engineering, Brno University of Technology, Czech Republic). It contains tungsten disulfide (WS2) nanowires among other particles. These structures are several micrometers long and only a few hundred nanometers thick. Manually searching the sample at high magnification for the nanowires would be tedious and time-consuming. Using Particlescout, the desired nanowires were isolated within seconds. A total of 3,135 particles were found, but only some of them were the desired nanowires (Fig. 3A). Specifying an aspect ratio of greater than 2.5 yielded 218 nanowires (Fig. 3B) that could be further investigated. For example, the anisotropic scattering behavior of the nanowires was studied. The intensity of the Raman shift peak at 421 cm-1 depends on the orientation of the nanowire with respect to the polarization of the excitation light (Fig. 3C). One particle was kept in focus while rotating the polarization of the excitation light. Plotting the intensity of the 421 cm-1 peak versus the angle between the laser polarization and the nanowire yields a sine curve (Fig. 3D).
As an example from the field of pharmaceutics and cosmetics, the components of a cosmetic peeling cream were analyzed using the alpha300 R confocal Raman microscope equipped with Particlescout. Image stitching and focus stacking were used to acquire a sharp bright field image of a large area (Fig. 4A). For illustration, a Raman image was overlaid and color-coded according to the identified components (Fig. 4B). The cream consists mainly of anatase and boron nitride particles in an oil matrix. Particlescout detected almost 4,000 particles in the sample area. They could be grouped according to physical parameters such as their circular equivalent diameters, perimeters and many others. Chemical identification of the particles made it possible to relate these physical properties to the respective materials. Particlescout can generate extensive reports. The size distribution for the different components reveals that boron nitride particles are statistically smaller than the anatase particles (Fig. 4C). The relative abundance of the different components is displayed in Figure 4D.
Conclusion: The solution for microparticle analysis
An automated particle analysis tool combined with confocal Raman microscopy provides a convenient solution to the challenges of microparticle analysis. Using a Witec confocal Raman microscope equipped with Particlescout, large numbers of particles can easily be found and categorized. Raman spectra can then be acquired automatically from every particle of interest. The seamlessly-integrated Raman spectral database management software, Truematch, enables quick and reliable identification of the particles. Reports summarize the results and relate the material to physical properties. The power of Particlescout has been demonstrated using three application examples from the fields of microplastic pollution, materials science and cosmetics.
References
[1] N.P. Ivleva, A.C. Wiesheu, R. Niessner (2017) Microplastic in Aquatic Ecosystems. Angew. Chem. Int. Ed. 56, pp. 1720-1739. doi: 10.1002/anie.201606957
[2] M. Vert, Y. Doi, K. Hellwich et al. (2012) Terminology for biorelated polymers and applications (IUPAC Recommendations 2012). Pure and Appl. Chem. 84, pp. 377-410. doi: 10.1351/PAC-REC-10-12-04
[3] C.F. Araujo, M.M. Nolasco, A.M.P. Ribeiro, P.J.A. Ribeiro-Claro (2018) Identification of microplastics using Raman spectroscopy: Latest developments and future prospects. Water Research 142, pp. 426-440. doi: 10.1016/j.watres.2018.05.060.
[4] V. Hidalgo-Ruz, L. Gutow, R.C. Thompson, M. Thiel (2012) Microplastics in the Marine Environment: A Review of the Methods Used for Identification and Quantification. Environ. Sci. Technol. 46, pp. 3060-3075. doi 10.1021/es2031505.
[5] A. Käppler, D. Fischer, S. Oberbeckmann, et al. (2016) Analysis of environmental microplastics by vibrational microspectroscopy: FTIR, Raman or both? Anal. Bioanal. Chem. 408, pp. 8377-8391. doi: 10.1007/s00216-016-9956-3
[6] P.M. Anger, E. von der Esch, T. Baumann, M. Elsner, R. Niessner, N.P. Ivleva (2018) Raman microspectroscopy as a tool for microplastic particle analysis. Trends in Analytical Chemistry 109, pp. 214-226. doi: 10.1016/j.trac.2018.10.010.
[7] J. Toporski, T. Dieing, O. Hollricher (eds.) Confocal Raman Microscopy. Springer International Publishing AG, 2nd ed. (2018) doi.org/10.1007/978-3-319-75380-5
* M. Böhmler, W. Ibach, D. Strom, E. Kallis, Witec GmbH, 89081, Ulm/Germany
(ID:46079958)
:quality(80)/p7i.vogel.de/wcms/bb/69/bb691bac4dbda490891d061ed43aa5e2/0127562694v1.jpeg "Particle vision analysis links exploration, experiments, and feedback, turning microscopic observations into new discoveries or optimized manufacturing conditions.
(Source: Guangyao Chen/ Fengqi You)")
:quality(80)/p7i.vogel.de/wcms/e2/50/e25060efc5d415df36685fce9e64f047/0128496870v2.jpeg "SFG microscopy image of boron nitride monolayer flakes. (Source: FHI)")